
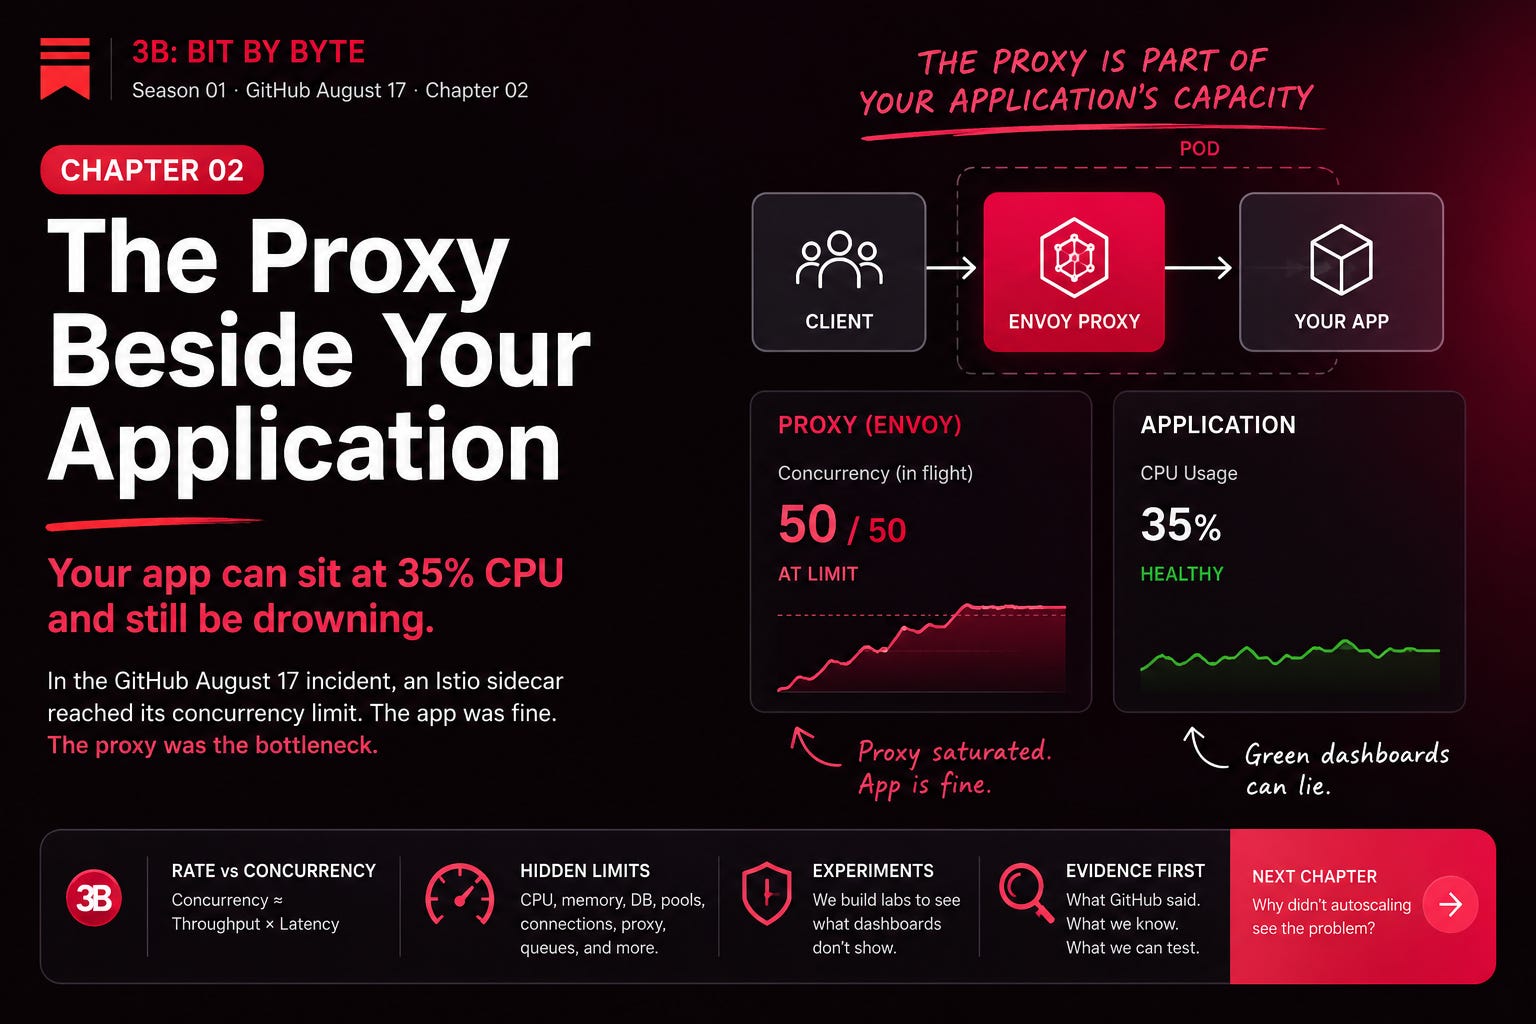
The dashboard is green. Picture the moment. An incident channel is on fire. Requests are failing. Customers are complaining. And you, half-panicked, pull up the metrics for the service everyone is blaming.
CPU: 35%. Memory: comfortable. Latency inside the application code: fine. The health check is passing. By every number you have been trained to trust, this service is healthy.
And yet a large fraction of the traffic aimed at it never gets a clean answer.
This is the moment a lot of engineers (me included, more than once) start to doubt their own tools. The graphs say one thing, reality says another, and it is almost always because you are measuring one resource while a different one ran out. In the August 17 GitHub incident, one of the critical limits was not in the application at all. It was in the proxy sitting beside it.
Let me state the principle before I unpack it, because the whole chapter hangs on this one sentence.
The proxy beside your workload is part of your application’s capacity.
If you only remember one thing, remember that. Now let’s earn it.
GitHub says
I want to stay honest about what is documented and what is me reasoning. So, the facts first.
GitHub’s incident report states that the immediate cause was network saturation on load balancers in Central US after a new traffic peak, and that an Istio sidecar reached its concurrency limit. It also says autoscaling did not react correctly, because the scaling policy watched the host service rather than the sidecar’s limits.
That is the primary evidence for this chapter. Two phrases do the heavy lifting: Istio sidecar and concurrency limit. Everything else I write here is either general mechanism or an experiment. I will keep the buckets separate.
We can reason about: what a sidecar actually is
Here is the part that is safe to reason about, because it is how service meshes work in general, not a claim about GitHub’s private setup.
First, two words that get used interchangeably and should not be.
Istio is the control plane. It is the brain that holds the rules. Which service can talk to which, what the timeouts are, how many concurrent requests are allowed, how traffic gets routed and retried. Istio manages the mesh’s configuration and policy and hands it down; it is not the thing sitting in the request path itself.
Envoy is the data plane. It is the proxy that actually sits in the request path and enforces the rules Istio handed it. Every real request flows through Envoy. Istio writes the law, Envoy is the officer on the road.
A useful compression: Istio decides the rules, Envoy handles the traffic.
Now the sidecar pattern. In Kubernetes, a “pod” can hold more than one container. A common Kubernetes sidecar pattern puts the Envoy proxy in the same pod as the application container. They share a network namespace, so from the application’s point of view the proxy is basically localhost.
The consequence is quiet but important: your application usually does not receive requests directly. Inbound traffic hits the Envoy proxy first, then Envoy forwards it to your app. Outbound traffic leaves your app, hits Envoy, then goes to the world.
                 pod
        +-----------------------+
Client -> [ Envoy proxy ] -> [ Your app ]
        +-----------------------+
Why add a whole extra network hop next to every service? Because that proxy gives you routing, connection pooling, mutual TLS, retries, timeouts, and consistent telemetry, all without changing your application code. You get platform-level traffic behavior for free from the app’s perspective.
But “free from the app’s perspective” is exactly the trap.
That proxy is a real process. It has its own memory. Its own connection pool. Its own CPU. And its own concurrency limit: a cap on how many requests it will handle in flight at the same time.
Concurrency is worth defining precisely, because it is not the same as requests per second. Requests per second is a rate: how many arrive each second. Concurrency is how many are simultaneously in flight right now, still waiting for a response. If requests take 100 milliseconds, a proxy at 1,000 requests per second is holding about 100 in flight at once. If something downstream slows and each request now takes 1 second, that same 1,000 requests per second means about 1,000 in flight. The arrival rate did not change. The concurrency went up 10x.
The relationship is simple: concurrency is roughly throughput times latency (concurrency ≈ throughput × latency). Same arrival rate, 10x the latency, roughly 10x the in-flight work. That single fact is why a small slowdown downstream can saturate a proxy that was comfortable a moment ago.
That is the mechanism to hold onto when reading GitHub’s line that an Istio sidecar reached its concurrency limit. Here is the shape of the failure, reasoned generally. A proxy with a concurrency limit of, say, 1,000 is perfectly fine at 100 in flight. Then latency creeps up somewhere downstream. In-flight count climbs: 300, 600, 900, 1,000. Now the proxy is at its limit. Additional requests may be rejected or forced to wait, depending on how that limit is enforced.
And the application behind that proxy? It is still at 35% CPU. It never even saw those requests. It is idle and healthy while the doorway in front of it is jammed shut.
That is what I mean by “the proxy is part of your capacity.” Your capacity is not CPU. It is not memory. It is not replica count. Your effective capacity is constrained by the first necessary resource to reach its limit, and that resource can be any of:
Application CPU
Application memory
Database connections
Thread pools
Network connections
Proxy concurrency
Queue depth
Application CPU is only one entry on that list. Proxy concurrency is another. On August 17, per GitHub, the sidecar’s concurrency limit was one of the limits the system could not scale past. The durable question to leave with is not “how does Istio work” but “which of these invisible limits is closest to the edge in my system, and am I graphing it?”
We don’t know
I want to be careful here, because this is the exact place where it is tempting to invent an architecture.
I do not know GitHub’s actual concurrency numbers, how their sidecars were deployed, what the limits were set to, or how their pods were laid out. I do not know whether the picture above matches their topology at all. GitHub’s report tells us a sidecar reached a concurrency limit. It does not hand us the diagram, and I am not going to draw one for them.
What I can do is build a tiny system that has the same shape, and watch the behavior happen with my own eyes.
Let’s experiment
Before the code, hold one picture in your head, because every number below is that picture with instruments attached.
Think of a room with a fire-code capacity of fifty, and one doorway with someone counting people through it. Below fifty, everyone walks straight in. At fifty, the next person waits outside, or gets turned away, no matter how empty the room looks to the people already inside. The doorway is the proxy. Fifty is its concurrency limit. The people in the room are requests in flight, and the room itself is your service: it can feel half-empty while a crowd piles up at its one door.
So I built exactly that. It is small enough to run on a laptop, and it ships with this chapter (link at the end of the section). Three pieces:
Client -> Proxy (concurrency limit) -> Service (healthy, fast)
The Service is deliberately boring and healthy. It does a tiny slice of work per request (20 milliseconds) and returns. Low load. It is not the villain, and that is the whole point.
The Proxy sits in front of it and enforces a hard concurrency limit: at most 50 requests in flight at once. Anything beyond that is rejected at the door. Envoy provides mechanisms for limiting concurrent requests. For the lab, I model the same constraint with a semaphore: a counting gate that allows only 50 requests to be in flight at a time. I am demonstrating the capacity mechanism, not reproducing Envoy’s internals.
The Client ramps up: 10 concurrent requests, then 30, then 60, then 120.
Then I watch what the service experiences and what the client experiences, side by side. Here is the actual output of one run:
Client  Svc CPU  Svc peak  Proxy   Success
 conc   (model)  in-flight reject  rate
────────────────────────────────────────────
 10     7%       10        0       100%
 30     21%      30        0       100%
 60     35%      50        960     83%
 120    35%      50        6720    42%
Two things happen at once, and they are the whole chapter.
Below 50 concurrent, everything is green: the service load climbs with the client, no rejections, every request succeeds.
Push past 50 and the two stories split. The service’s in-flight count pins at 50 and never climbs again, because the proxy will not admit a 51st request: the room is full. Its load, and so its CPU, has a ceiling that the client cannot push past. But the client’s success rate falls off a cliff: 83% at 60 concurrent, 42% at 120. The proxy is turning the overflow away at the door, and the requests aimed at a perfectly healthy service simply never reach it.
One honest note on that table: service CPU is the one modeled number, not a measured one, because real per-request CPU is too noisy to ship a reproducible result. The model is deliberately simple: the service runs at 35% when it is handling its 50-request ceiling, and scales down from there. Everything else, the rejections, the success rate, the in-flight counts, is measured from the run. The ceiling is the part that matters, and the ceiling is real: the proxy caps how many requests ever reach the service.
That is the entire lesson, made physical. Two numbers telling opposite stories about the same system. The service says “I am at 35% and fine.” The client says “I am failing 58% of the time.” Both are true. The truth lives in the proxy, and nobody was looking at it.
The code is in the season repo under 3b-bit-by-byte/season-01-github-august-17/02-proxy-concurrency/. Run go run ./minimal for the bare mechanism and one plain table, go run . for the full instrumented run above, or go run ./tui to turn the load knob yourself and watch the service bar freeze at the limit while the client bar keeps climbing. Flip on --queue and the failures turn into latency instead of errors; raise --service-ms and throughput falls while the CPU ceiling holds, because the service can only ever clear about fifty requests per service-time. That last one is the earlier concurrency ≈ throughput × latency made live: at a fixed limit, faster requests mean more goodput and slower requests mean less, for exactly the same proxy.
Back to the incident
So when GitHub says a sidecar reached its concurrency limit, this is the mechanism worth carrying: a proxy beside the workload has its own hard limits, independent of the application’s CPU, and when it saturates, the application can look perfectly healthy while the requests aimed at it fail.
Green dashboards are not proof of health. They are proof that the thing you graphed is healthy. The proxy beside your application deserves its own graph.
Which raises the obvious next question. If the app was fine and the proxy was the bottleneck, why didn’t autoscaling notice and add more capacity? Because autoscaling can only react to what it is told to watch, and it was watching the wrong thing.
Next in 3B: Bit By Byte
Chapter 3, When CPU Says Everything Is Fine. We follow the scaling signal that missed the real limit.
If you want the rest of this investigation as it lands, one question at a time, subscribe and follow along.