
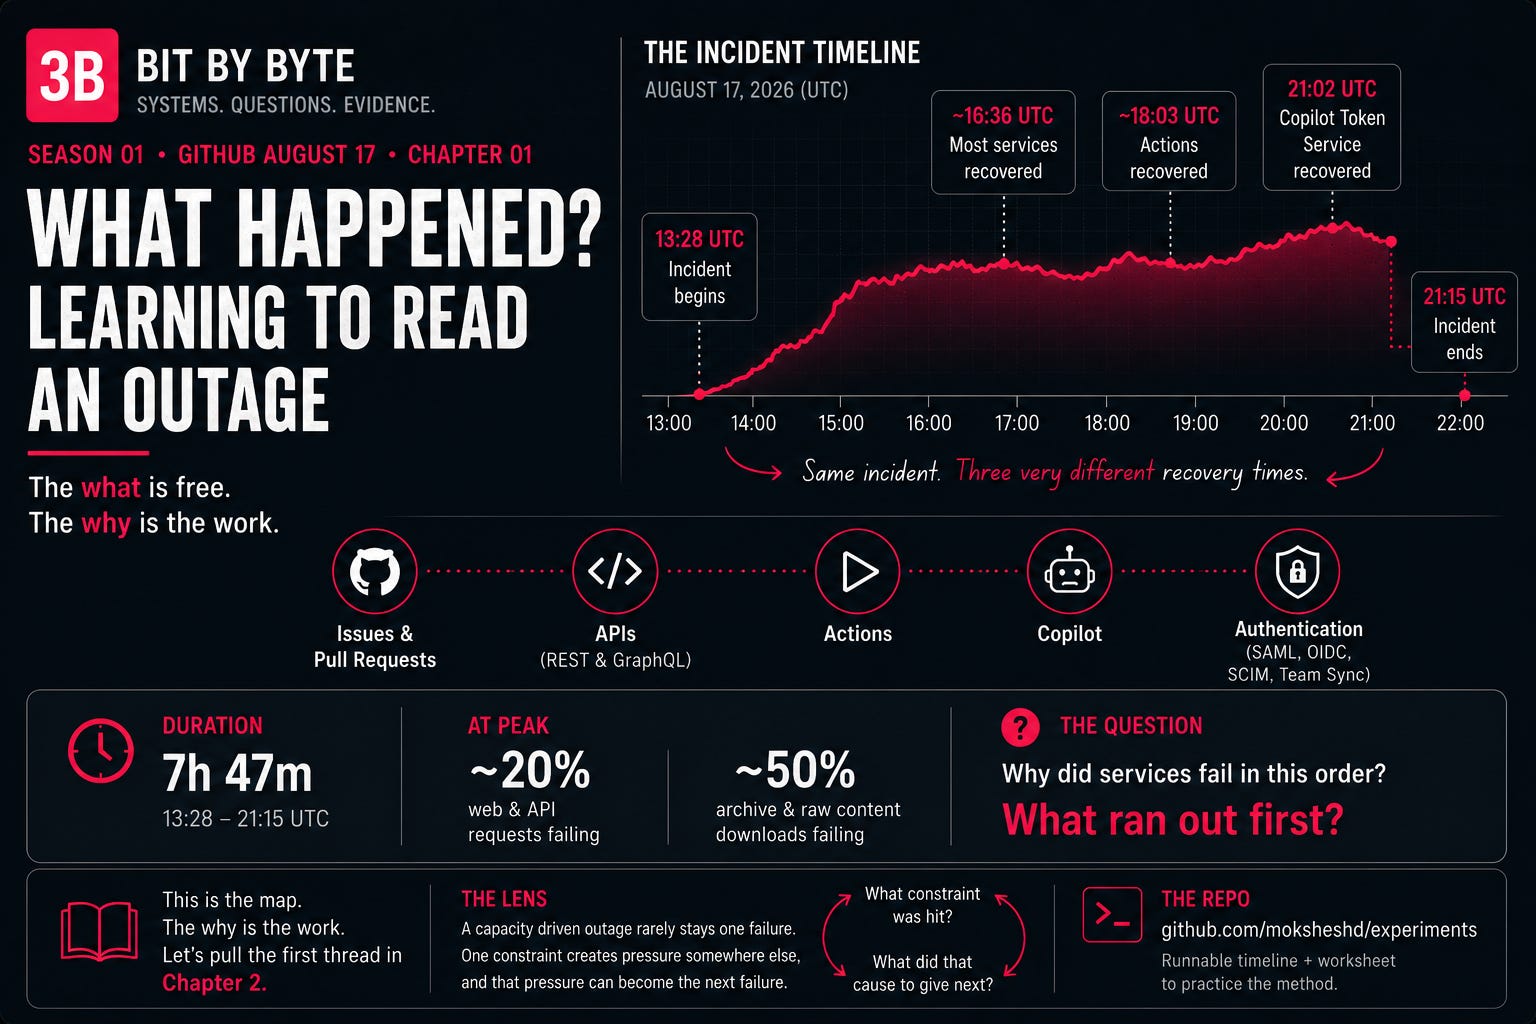
At 13:28 UTC on August 17, 2026, GitHub.com started experiencing elevated errors and latency.
Issues and Pull Requests were affected. The APIs were affected. Actions was affected. Copilot was affected. Authentication was affected. But they did not all fail in the same way, and they did not all recover at the same time.
By the time it was over, the clock read 7 hours and 47 minutes. That is the headline number, and it is the easy one. Anyone can read that number. Anyone can read the list of things that broke. The interesting question, the one that actually teaches you something, is not what broke. It is why it broke in that order, and what ran out first.
That question is what this whole season is about. In this first chapter I just want to lay out the map and teach you how to read it.
GitHub says
Let me be strict about sourcing, because that discipline is the entire point of 3B. Everything here is from GitHub’s own incident writeup and status page. When I say “GitHub says,” I mean it is documented by the people who were there. When I start reasoning, I will label it. When the evidence runs out, I will say “we don’t know.”
And I am going to stop at the symptoms. Not the causes. The causal chain is the rest of the season, and I refuse to hand it to you as one tidy paragraph you will have forgotten by tomorrow.
The incident ran 13:28 to 21:15 UTC: 7 hours and 47 minutes. In that window a lot of GitHub did not work. Issues and Pull Requests. The REST and GraphQL APIs. Actions. Copilot. Sign-in itself: SAML and OIDC, SCIM, Team Sync. At the peak, roughly one in five web and API requests were failing. For archive and raw content downloads, closer to one in two.
Recovery did not arrive all at once, and the staggering is the clue I want you to carry. Most services were back around 16:36 UTC. Actions dragged until about 18:03. And one service, the Copilot Token Service, did not fully recover until 21:02, hours after everything else. Same incident, wildly different recovery times. Sit with that gap. It is a question this season exists to answer.
That is the what, and I am leaving it there on purpose. GitHub’s report does explain the causal chain, and it is a good one. But I am deliberately not compressing it into a paragraph here. Each link in that chain raises a different systems question, and those questions are where the useful lessons live. Fold it all into one tidy summary and you will nod, feel informed, and learn nothing. So I am going to spend the chapters ahead pulling it apart one link at a time.
The lens
Here is the lens I want you to take from this chapter, stated plainly:
A capacity driven outage rarely stays one failure. One constraint creates pressure somewhere else, and that pressure can become the next failure.
Sometimes that constraint is literal exhaustion. Sometimes it is a concurrency limit, a queue boundary, or another imposed ceiling.
Notice the words “capacity driven.” Not every outage works this way. Plenty are caused by a bad deploy, a config mistake, an expired certificate, corrupted state, a routing error, a plain software defect, and for those, “what ran out” is the wrong question entirely. But when an incident is about capacity, it rarely stays a single failure, because an exhausted resource does not fail politely in place. It pushes load somewhere it was not expected, and that somewhere becomes the next thing to give.
So when I read a capacity related incident, I keep two questions running in a loop:
What constraint was hit? And what did that cause to give next? “What ran out?” is the shorthand I actually say in my head, as long as I remember that not every constraint is literal exhaustion.
August 17 mostly reads that way, though not entirely: a couple of its links are not simple exhaustion, and we will get to those honestly when we reach them. You do not have the pieces to trace the chain yet. That is the point of the chapters ahead. For now, practice the reading itself.
How to think about it
When you read an incident, yours or anyone else’s, hold three buckets separately and refuse to let them blur.
1. What we know. What the evidence explicitly establishes. Timestamps, error rates, the named components. No interpretation yet.
2. What we can reason about. The engineering mechanisms that could explain those observations. This is where you get to be clever, but honestly labeled: you are reasoning, not reporting.
3. What we do not know. Where the public evidence stops. Naming the gap is not a weakness. It is the difference between someone who understands a system and someone who is performing understanding.
I want to get comfortable saying “we don’t know,” because otherwise reasoning quietly turns into storytelling.
Most of this chapter has lived in the first bucket on purpose. We build the evidence base before we build any theories on top of it.
A practice for this week
Find one incident report. GitHub’s, or your own team’s last postmortem, or any public one you can get your hands on.
One rule before you start: do not read the root cause section yet. Read the symptoms, then write down what you think the mechanism was, in your own words, before you look. Only afterward compare your hypothesis against what the report actually concluded. The gap between the two is the lesson. It is the difference between observation leading to hypothesis leading to evidence, and simply copying an answer out of a postmortem.
Read it once for the story. Then read it a second time with a pen. Next to every failure, ask: was something exhausted here, and if so, what? Connections? Concurrency? Memory? Queue capacity? Network flows? Regional capacity? And if nothing seems to have been exhausted, ask what other mechanism produced the failure: a bad deploy, a config change, an expired certificate, a logic bug. Do not stop at “the service was slow.” Slow because of what?
If you cannot name the mechanism, that is not a failure of the exercise. That is you finding an edge of the report, a place where the what is documented but the why is not. Mark it. Those edges are exactly where the interesting work starts.
The repo
Everything in 3B ships with runnable code, and Chapter 1 is no exception. In the season repo I keep the August 17 timeline as a small machine-readable file, plus a short worksheet script that walks you through it one event at a time and asks the only question that matters: what ran out here? It is the practice above, automated, and it is the seed the rest of the season’s lab grows from.
Clone it and follow along:
git clone git@github.com:moksheshd/experiments.git
cd experiments/3b-bit-by-byte/season-01-github-august-17/01-reading-an-outage
The repo: github.com/moksheshd/experiments
Next in 3B: Bit By Byte
We start pulling the first thread. GitHub names an Istio sidecar, a proxy that sits right next to the application, and most engineers have never really looked at it. Next, in Chapter 2, The Proxy Beside Your Application, we find out what that thing actually does, why it has a concurrency limit at all, and why watching the wrong signal to scale it can quietly set a fire.
Some of the questions ahead will sound embarrassingly basic. Why do we even need a proxy there? Why didn’t CPU go up? Why retry something that is already overloaded? Ask them anyway. Basic questions asked relentlessly, held strictly to what the evidence proves, are the whole method.
If you want to follow the whole teardown, subscribe and come along.