
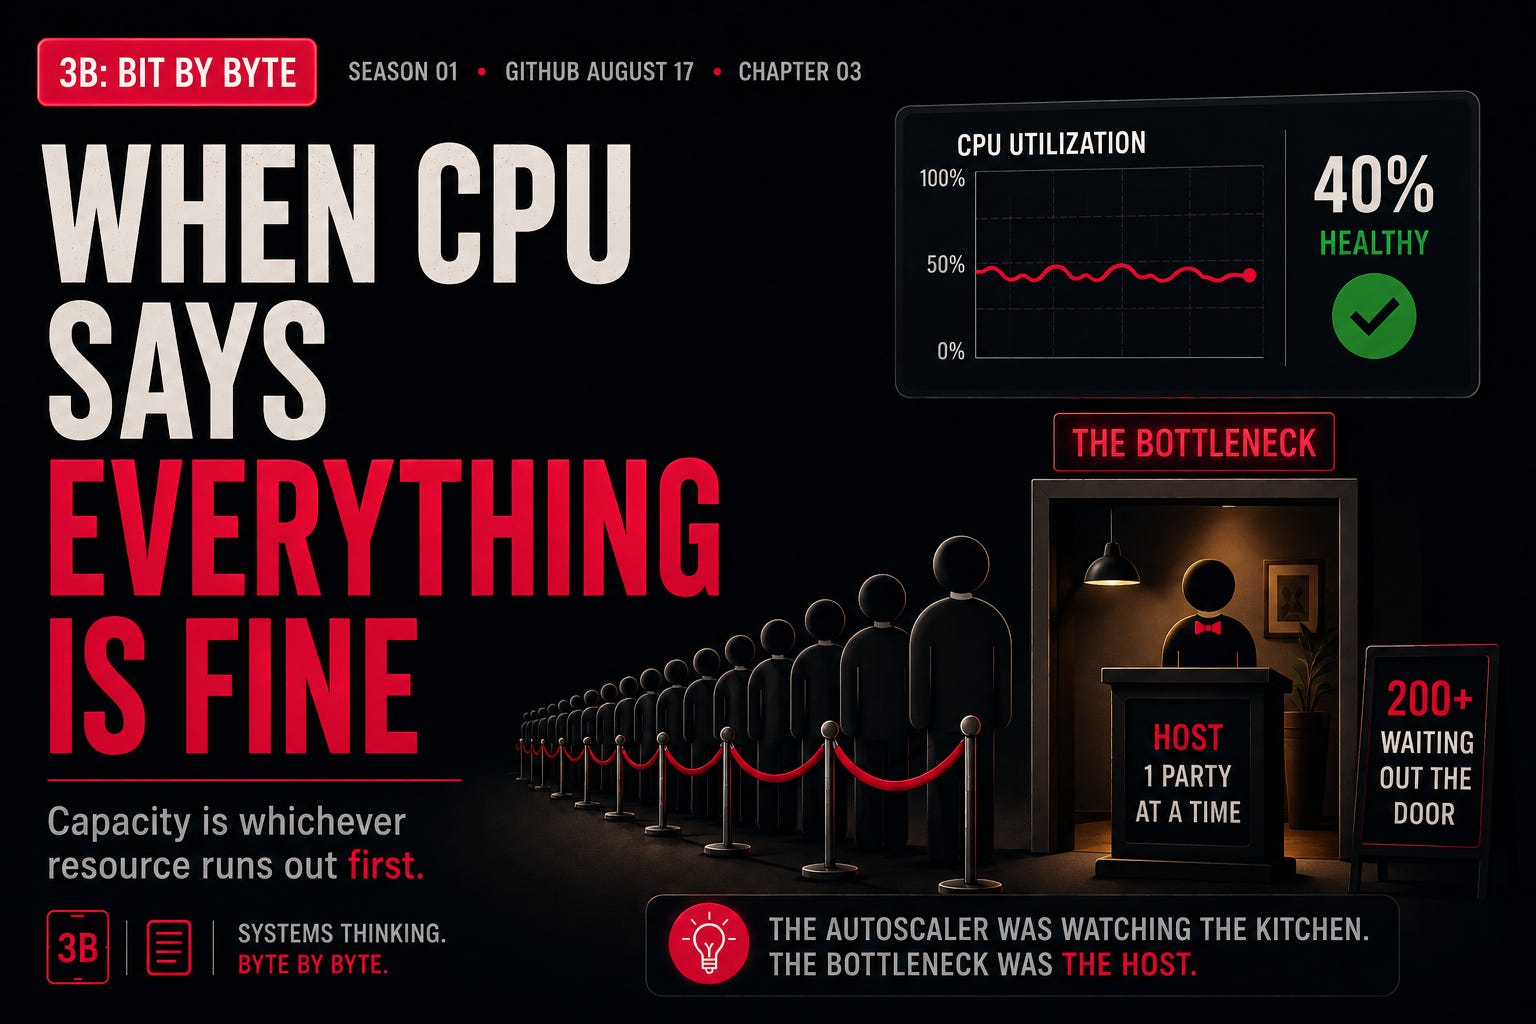
Picture a restaurant on its busiest night. Walk into the kitchen and everything looks calm. The chefs are moving at maybe 40% of what they can do. Nobody is sweating, nothing is on fire, the line is not backed up. If you managed only by looking at the kitchen, you would conclude the restaurant has plenty of room to spare.
Now walk out to the front. There are 200 people waiting at reception. There is exactly one host, and the host can seat one party at a time. The line is out the door and around the corner.
The kitchen graph is green. The restaurant is failing.
Nothing about the kitchen is wrong. The measurement is honest. The chefs really are at 40%. But the number you are staring at has almost nothing to do with the thing that is actually limiting the restaurant tonight. The bottleneck is the host, and no dashboard in the kitchen will ever show it to you.
This is the whole idea of this chapter, and it is one of the most useful mental models the August 17 incident hands us:
CPU is not capacity. Capacity is whichever resource runs out first.
The principle, stated plainly
We tend to talk about a service being “at capacity” as if capacity were one number. It is not. A running service depends on a whole set of resources at once. CPU. Memory. Open connections. Network bandwidth. File descriptors. Concurrency slots in a proxy. Slots in a queue. Threads in a pool.
Your effective capacity is not the average of those. It is the minimum. You can do at most as much work as your most-exhausted necessary resource allows, and not one request more. Everything else can be sitting idle at 40% and it will not help you, in the same way that empty tables do not help when there is nobody free to seat people.
So “are we at capacity?” is the wrong question. The better one is: which resource are we about to run out of first, and are we even watching it?
Translating this to your world
You have almost certainly lived the green-graph version of this.
An incident is happening. Users are seeing errors. And you are looking at a CPU chart that is calm, a memory chart that is calm, and you are thinking: the box is fine, so it cannot be us. Meanwhile the thing that is actually saturated is a connection pool, or a downstream rate limit, or the number of requests a proxy will hold at once. It never showed up on the charts you happened to open, so for the first twenty minutes it did not exist to you.
CPU gets this starring role for a boring reason: it is easy to measure and it is on every dashboard by default. Ease of measurement is not the same as relevance to the bottleneck. That gap is where outages hide.
There is a second half to this that is worth slowing down on, because it is where the incident gets its teeth. It has to do with concurrency, and how it grows even when nothing about your traffic changes.
Concurrency, and why it grows when you are not looking
Concurrency is just the number of requests in flight at the same instant. Not requests per second, which counts how fast they arrive. Concurrency counts how many are sitting inside your system right now, still being worked on.
Here is the part that surprises people. Concurrency can climb even when your request rate is perfectly flat.
Think about it with a mental picture. Suppose 1,000 requests arrive every second, and each one normally finishes in 100 milliseconds. At any given instant, roughly 100 of them are in flight. That is your concurrency. Comfortable.
Now something downstream slows down, and each request starts taking 1 second instead of 100 milliseconds. The arrival rate has not changed at all. Still 1,000 per second. But now each request lingers ten times longer, so roughly 1,000 of them are in flight at once. Your concurrency went up 10x, and your traffic did not move an inch.
That relationship has a name. In plain language: concurrency is roughly the arrival rate multiplied by how long each request takes. (People call this Little’s Law.) You do not need the math. You need the intuition: when latency rises, concurrency rises with it, silently, for free, without any new users showing up. Slowness quietly consumes concurrency.
And concurrency is exactly the kind of resource that has a hard ceiling. A proxy will only hold so many requests at once. When it hits that number, it does not run hot on CPU. It just refuses, or queues, or stalls.
GitHub says
Here is what we actually know, kept strictly to the record.
GitHub reported that during the August 17 incident an Istio sidecar reached its concurrency limit. It also reported that the autoscaling policy was configured around the host service rather than the sidecar’s own resource limits.
Read those two sentences together and the restaurant snaps into focus. The autoscaler was watching the kitchen. The bottleneck was the host. The scaling policy was pointed at the application, and the resource that actually ran out was the concurrency ceiling of the proxy sitting beside it.
Notice what this is not. The autoscaler was not broken. As far as the evidence tells us, it did exactly what it was configured to do. It looked at its metric, saw a healthy number, and correctly decided not to add capacity. A rational decision, made on an honest measurement, of the wrong thing. That is a far more unsettling failure than a bug, because the system was working as designed and still walked straight into the wall.
That gives us the question this whole chapter is really about:
Are we scaling on what is easy to measure, or on what actually limits throughput?
What we do not know, and will not pretend to: the exact numbers, the specific thresholds, or why the policy was pointed where it was. GitHub’s report does not say, so neither do we. The shape is what we are after, and the shape is clear enough.
Let’s experiment
The honest way to trust a claim like “the autoscaler watched the wrong thing” is to build the smallest system where it happens on purpose, and watch it fail.
Before the code, one last translation, because every number below is that scene with instruments attached. The kitchen is the service and the chefs at 40% are its CPU. The one host at the door is the proxy with its concurrency limit. The line out the door is requests in flight. And the manager who decides whether to call in more staff, by glancing only at the kitchen, is the autoscaler.
So I built exactly that. It is small enough to run on a laptop, and it ships with this chapter (link at the end of the section). Same Client -> Proxy -> Service as the last chapter, with two changes that make this one’s point:
Client (flat rate) -> Proxy (concurrency limit) -> Service (getting slower)The Client is now open-loop: it fires at a fixed arrival rate, 1,000 requests per second, and never slows down no matter how long requests take. That is the whole setup. The arrival rate is held flat all run, so any rise in concurrency comes from latency alone, not from more traffic.
The Proxy enforces a concurrency limit of 100 per replica, and an autoscaler can add replicas to raise that ceiling. The autoscaler reads one metric several times a second and applies the ordinary scaling rule: if the metric is above target, add capacity.
The Service is healthy, and I make it slower on purpose, step by step: 50ms per request, then 100, then 200, then 400. That is the dependency degrading, each order taking longer to plate.
One measurement note before the tables, because a reader who sees Svc CPU 40% will reasonably assume it was measured. It was not. Service CPU is the one modeled number, not a measured one, because real per-request CPU is too noisy to ship a reproducible result. The model is deliberately simple and stated in the code: CPU tracks the real work the service actually completes, so when the proxy caps throughput, CPU falls with it. Everything else, the in-flight counts, the rejections, and the replica counts the autoscaler settles on, comes straight from the run. And the direction is the part that matters: In this experiment, rising latency never raises CPU, so a CPU-watching autoscaler cannot be provoked into scaling, no matter how bad things get.
Two column notes as well. Offered is the average concurrency the load implies, arrival rate times latency. In-flight is the measured peak, which sits a little above that average because the open-loop client fires in small bursts rather than a perfectly smooth trickle.
First run, the autoscaler watches service CPU. Here is the actual output:
Autoscaler watches SERVICE CPU
Latency  Offered  In-flight  Replicas  Svc CPU  Reject
 (svc)   conc     peak       (scaled)  (model)  rate
 50ms    50       60         1         40%      0%
 100ms   100      100        1         37%      8%
 200ms   200      100        1         19%      51%
 400ms   400      100        1         11%      74%
Read it top to bottom. The arrival rate never moved. But the Offered column climbs 50, 100, 200, 400, exactly as Little’s Law says it must. In-flight requests press against the proxy’s limit of 100 and stop there, because the proxy cannot admit the 101st request concurrently. And service CPU, the one number the autoscaler is watching, does not rise. It falls: 40%, 37%, 19%, 11%. The capped service is completing less real work per second while the overflow piles up at the door, so it looks more idle exactly as the outage gets worse. The autoscaler sees a healthy, falling number, holds at one replica, and by the last row is turning away almost three of every four requests.
Green CPU, failing service, and an autoscaler doing its job perfectly on an honest measurement of the wrong thing.
Now change one thing. Point the same autoscaler at proxy concurrency instead of CPU, and run the identical experiment:
Autoscaler watches PROXY CONCURRENCY
Latency  Offered  In-flight  Replicas  Svc CPU  Reject
 (svc)   conc     peak       (scaled)  (model)  rate
 50ms    50       60         1         40%      0%
 100ms   100      110        2         40%      0%
 200ms   200      210        3         40%      0%
 400ms   400      410        5         40%      0%
Same load, same slowdown, same scaling rule. The only thing we changed was what the autoscaler could see. But now the signal tracks the resource that actually saturates, so as concurrency climbs the autoscaler grows from 1 replica to 5, capacity keeps pace with the in-flight count, CPU holds near its 40% baseline, and nothing is rejected. The manager finally added hosts, because they were finally watching the door.
The code is in the season repo on GitHub, under 03-autoscaling-blind-spot/. Run go run ./minimal for the bare blind spot and one plain table, go run . for the full side-by-side run above, or go run ./tui to dial the latency yourself and toggle the autoscaler's signal live: watch CPU-watching do nothing while the reject bar climbs, then press one key to switch to concurrency and watch the replicas jump and the failures vanish. The reasoning stands on its own too: capacity is set by the first resource to run out, concurrency is a resource, and you cannot scale on a signal you never measured.
Next in 3B: Bit By Byte
There is a loose thread I left dangling. When requests start stalling and failing, the most natural thing in the world happens: everyone tries again. Retries are supposed to make systems more reliable. On August 17 they helped turn a constrained proxy into a much larger outage.
Chapter 4, When Retries Become the Outage. How the thing built to save you becomes the fuel, and what you do about it.
If you want the next question in your inbox when it lands, subscribe. That is the whole ask.